Churn rate can be a good indicator of whether your product or app will sink or swim, in this post, you'll learn how to measure churn rate and product stickiness with daily active users (DAU) and monthly active users (MAU) from product user activity (clickstream event-level data).
You may also want to read my article on cohort analysis and retention.
Executive/VC If you are an executive, a VC or are simply in a rush, jump directly to the Churn, MAU, DAU Dashboard
Churn Rate
Churn rate is a measure of the number of individuals moving out of a collective group (e.g. users) over a specific period.
It is an important factor for any business with a subscriber-based service model. - Wikipedia
Although churn applies mostly to subscription-based products, you can look at product usage as a subscription; you want to create loyal users and product stickiness.
To measure churn rate, DAU and MAU, you'll need:
- Track your product with an analytics software
- Have a unique user identifier
- Have access raw event-level data from your analytics software
If you don't have access to your product raw event-level data, let's chat, we can help you.

The illustration below shows a customer product usage timeline. We'll define four distinct stages for each customer: active (executed a key task), considered active (didn't run a key task but is in a grace period for x days) and churned (considered lost for x days).
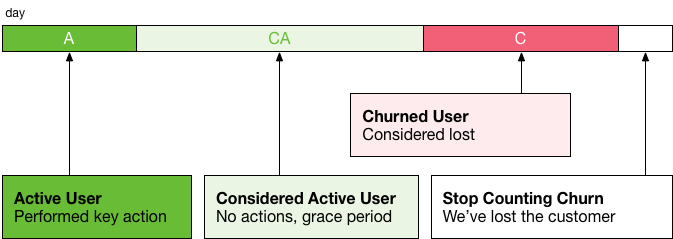
Define Active And Churned Users
An active user is any customer who executed at least one key task in the previous 30 days. A key task is an action that is tightly related to the product main purpose. If our product were Instagram our key task would be to post a photo for example.
A churned user is any customer who hasn't performed a key task in the last 30 days.
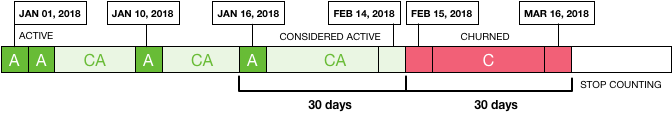
Consider the example timeline below, where a customer uses the product for the last time on January 16th, is considered active for 30 days and on the 31st is considered churn for an additional 30 days.
Data Required to Calculate The Daily Churn
To calculate daily churn, you'll need a table with the date, user id and the number of key actions performed on that day. Notice the date is not continuous. If a customer hasn't completed tasks on a particular date that record will not exist.
| date | user_id | tasks |
|---|---|---|
| 2018-01-01 | joao | 2 |
| 2018-01-02 | joao | 10 |
| 2018-01-10 | joao | 1 |
| 2018-01-16 | joao | 1 |
Building The Daily Active User Data Model
You can apply the SQL code below to any clickstream data source with some modifications, including Google Analytics 360, Adobe Analytics Data Feeds or other home grown systems, in our case we use Snowplow Analytics, because we like to own our data.
Customer Activity
This SQL code captures the number of key tasks per user per day. In our example below for Snowplow Analytics.
/* Table activity */

SELECT
  DATE_TRUNC('day', collector_tstamp) :: DATE AS date,
  user_id,
  COUNT(DISTINCT(event_id)) AS tasks
FROM atomic.events
WHERE user_id IS NOT NULL
  AND se_category = 'ux'
  AND se_action = 'post-photo'
GROUP BY 1,2
Dates
Since you want to build a churn model per day, you'll need a continuous date. The easiest way to create this is query the activity table, assuming you will have at least one user performing one task on any given day.
The SQL code below will create a continuous date range.
/* Table dates */

CREATE VIEW churn.dates AS (
  SELECT
    date
  FROM churn.activity
  GROUP BY 1
  ORDER BY 1 DESC);
User Summary First And Last Dates
The SQL code below creates a table which contains the dates of the first and last key tasks for each user.
/* Table View user_summary */

CREATE VIEW churn.user_summary AS (
  SELECT
    DISTINCT(user_id) AS user_id,
    MIN(date) AS first_task_date,
    MAX(date) AS last_task_date
  FROM churn.activity
  WHERE tasks > 0
  GROUP BY 1);
Continuous User Activity
Create a user activity table that contains user activity per day, even if the records don't exist.
You can't create records before the first date the user has performed a key task, or 59 days after you last see a user key task, by which you stop counting the user as churn.
/* Table continuous_activity */

CREATE VIEW churn.continuous_activity AS (
    SELECT
      d.date,
      u.user_id,
      CASE
        WHEN t.tasks IS NULL THEN 0
        ELSE t.tasks
      END
    FROM churn.dates d
    JOIN churn.user_summary u
      ON d.date >= u.first_task_date
      AND d.date <= DATEADD(day,59,u.last_task_date)
    FULL JOIN churn.activity t
      ON t.user_id = u.user_id
      AND d.date = t.date
);
Daily Active Users (DAU) Data Model
Create a table with the status of each user (active: TRUE or FALSE) for the last 30 days since they performed a key task.
/* Table user_retention_metrics */

CREATE TABLE churn.user_retention_metrics AS (
  SELECT
    date,
    user_id,
    tasks,
    CASE
       WHEN SUM(tasks) OVER (PARTITION BY user_id ORDER BY date ROWS BETWEEN 29 PRECEDING AND CURRENT ROW) >= 1 THEN TRUE
       ELSE FALSE
    END AS active
    FROM churn.continuous_activity);
In case you are wondering, churn rate and monthly active users (MAU) are calculated using a calculated metrics in Tableau.
This step concludes the data model, and you're ready for the data visualization. In production, you may want to create materialized views and automate the execution of the SQL code.
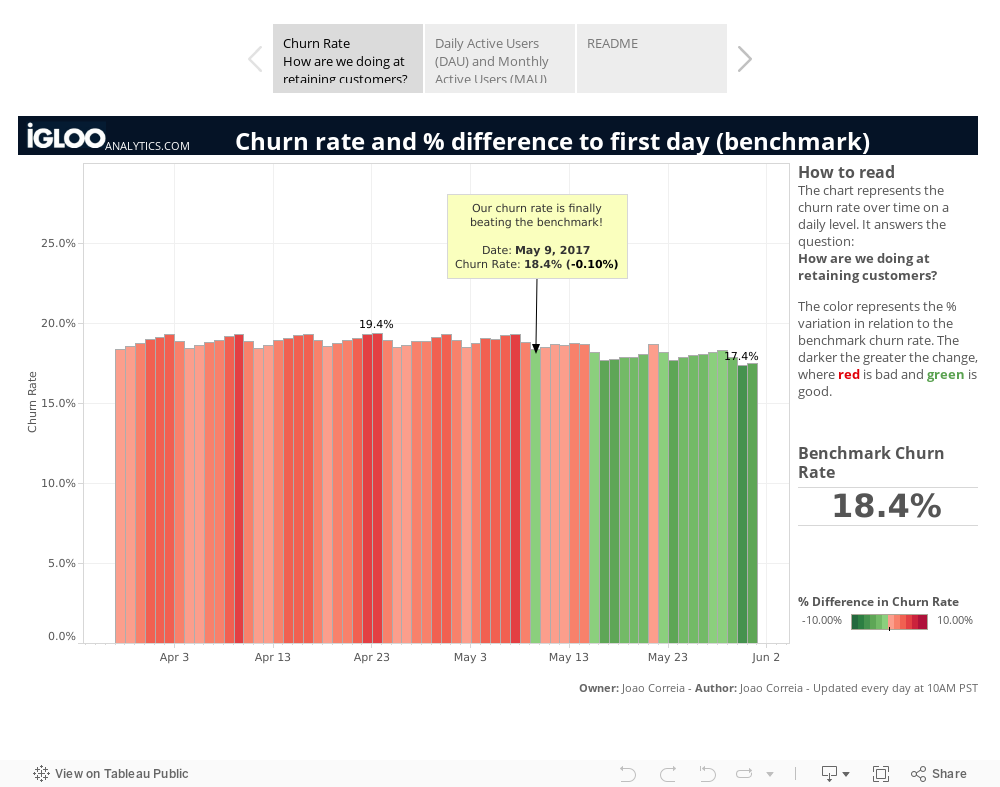
Churn Rate, DAU, and MAU Report
Interact with the tableau visualization below and download the Tableau workbook.
Closing remarks
Churn rate, DAU, MAU and DAU/MAU metrics are relatively simple to calculate and can provide you with insights on the health of your product.
It also enables you to compare your product performance against other products.
Share your comments or ideas about churn
Share your view in the comments section below.